There is plenty of benefit for healthcare providers in simplifying their registration process by implementing an electronic healthcare record (EHR). With the right integrated solutions, everything has to be entered only once and then it will be available virtually forever. Practitioners can use each other's registrations in HiX to stay perfectly up-to-date. Real-time exchange of patient information was the obvious first step. So what is the second step for healthcare organisations? Using this information to optimise their care. These organisations have huge amounts of data at their disposal which can be used to examine both their clinical and organisational processes.
Every facility has different needs
Every healthcare organisation needs information, about small, administrative questions – such as what patients are on a ward at any given moment but also about much larger issues, such as the capacity of the operation rooms.
HiX offers various solutions to these questions, including an overview generator and the HiX Data Warehouse. The overview generator can be used to generate ad hoc basic reports, using all the data in HiX. The Data Warehouse is a separate database that contains raw and enhanced HiX data. Because it's located on a separate server, it has no impact on the performance of the EHR.
The database refreshes regularly, so there is only a minimal delay ('near real-time'). However, in order to guarantee the stability of data during analysis, the data for reports refresh just once a day. This way, application managers and other end users can always be sure that they use the same data for interpretation and comparison.
It is also possible to set up an exchange to an external data warehouse. The architecture of the database is built to facilitate this link and to have any Data Warehouse function as an information source.
Ready-made solutions for data-driven healthcare
Like HiX itself, the integrated Data Warehouse contains an entire set of pre-configured content. This set consists of so-called 'dashboards' or 'cubes' (cuboidal diagrams) that can be used to visualise a wide variety of information.
These information tools can be opened directly in HiX without the need for external programmes. Dashboards allow healthcare organisations to map trends and to view the distributions between locations or departments. With cubes, they can even generate overviews and charts in an instant, using the pre-defined data models.
All your information needs covered
The flexible user-friendly applications of the HiX Data Warehouse provide easy access to standard reports as well as the flexibility necessary to meet all informational and reporting needs. Healthcare facilities can gain insights into trends, distributions and details using visual displays.
The dashboards always begin with the general overview, for example with all admissions and surgeries during a specific period. The user can then click through to more specific pages with detailed information such as the number of operations by specialisation. The data selection can be adjusted with filters for date, specialty and location.
The most specific page is the details page, which shows a detailed list that includes operations or appointments, for example. This page has filter options (such as the option to filter by time), that enable the physician to quickly retrieve the desired information, and moreover, the physician can access the registration within HiX, directly from this list. The detailed list can also be exported to Excel for further analysis.
We will describe one of the many solutions available in order to illustrate what the HiX Data Warehouse can do for your organisation: the 'nomenclature activities' dashboard. This dashboard allows physicians to gain an understanding of their own productivity on the basis of their billable activities. They can filter the data in this dashboard by year, month, (their own) physician's code, speciality, locations and type of admission. The data can then be displayed on a trend line, to be compared with the previous year's numbers. This way, it is easy to compare how their productivity has evolved from month to month, or year to year.
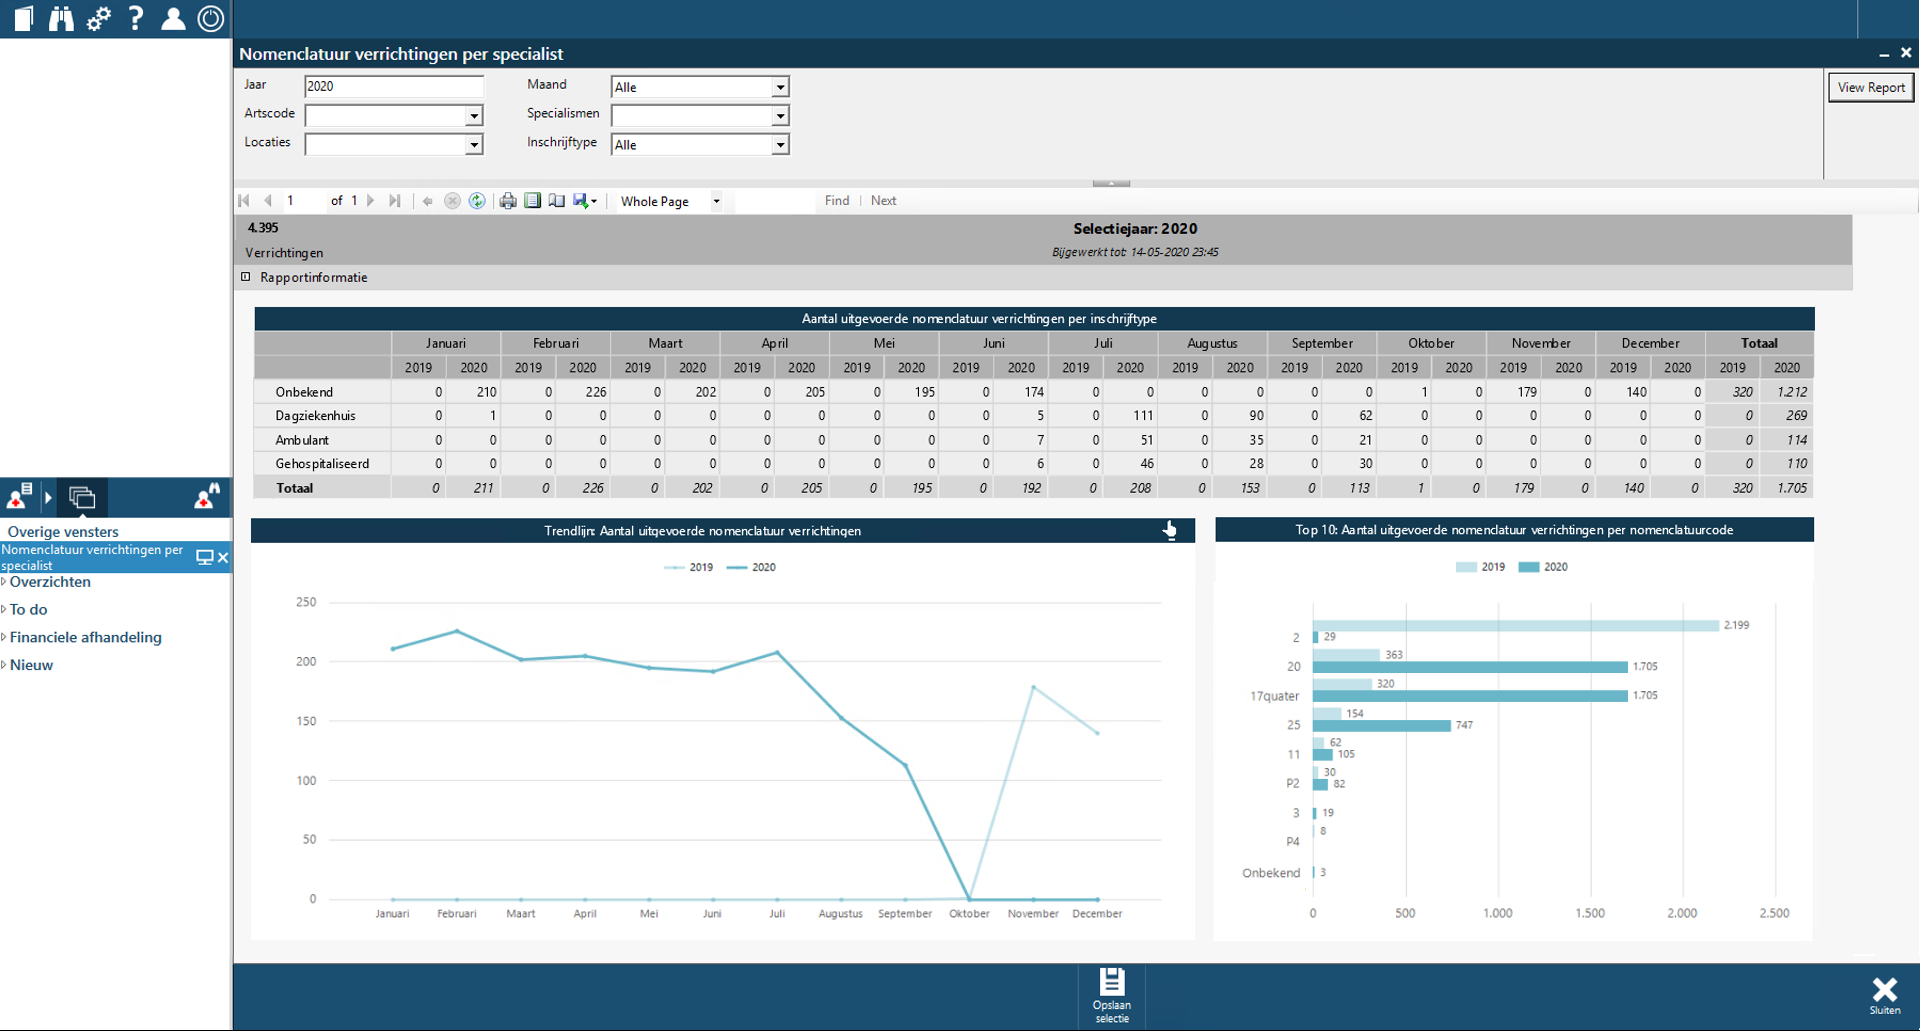 The 'nomenclature activities' cube also offers further options to compare information and present it. You can read more about cubes below.
Flexibility and customisation options
In addition to the available sets of reports, healthcare providers have the option to generate their own lists and reports using cubes. These are data models that can be opened using a pivot table in HiX. Users can choose measurements (such as 'number of admissions') and compare these with various dimensions (such as 'department' or 'priority') to create extensive reports. They also have the option to save a cube selection setting if they want to use it again later.
The HiX Data Warehouse and HiX's pre-configured content provide every healthcare organisation with simple and directly usable functionalities. These functionalities allow you to track and evaluate processes. The insights gained this way can be used to optimise those processes.


